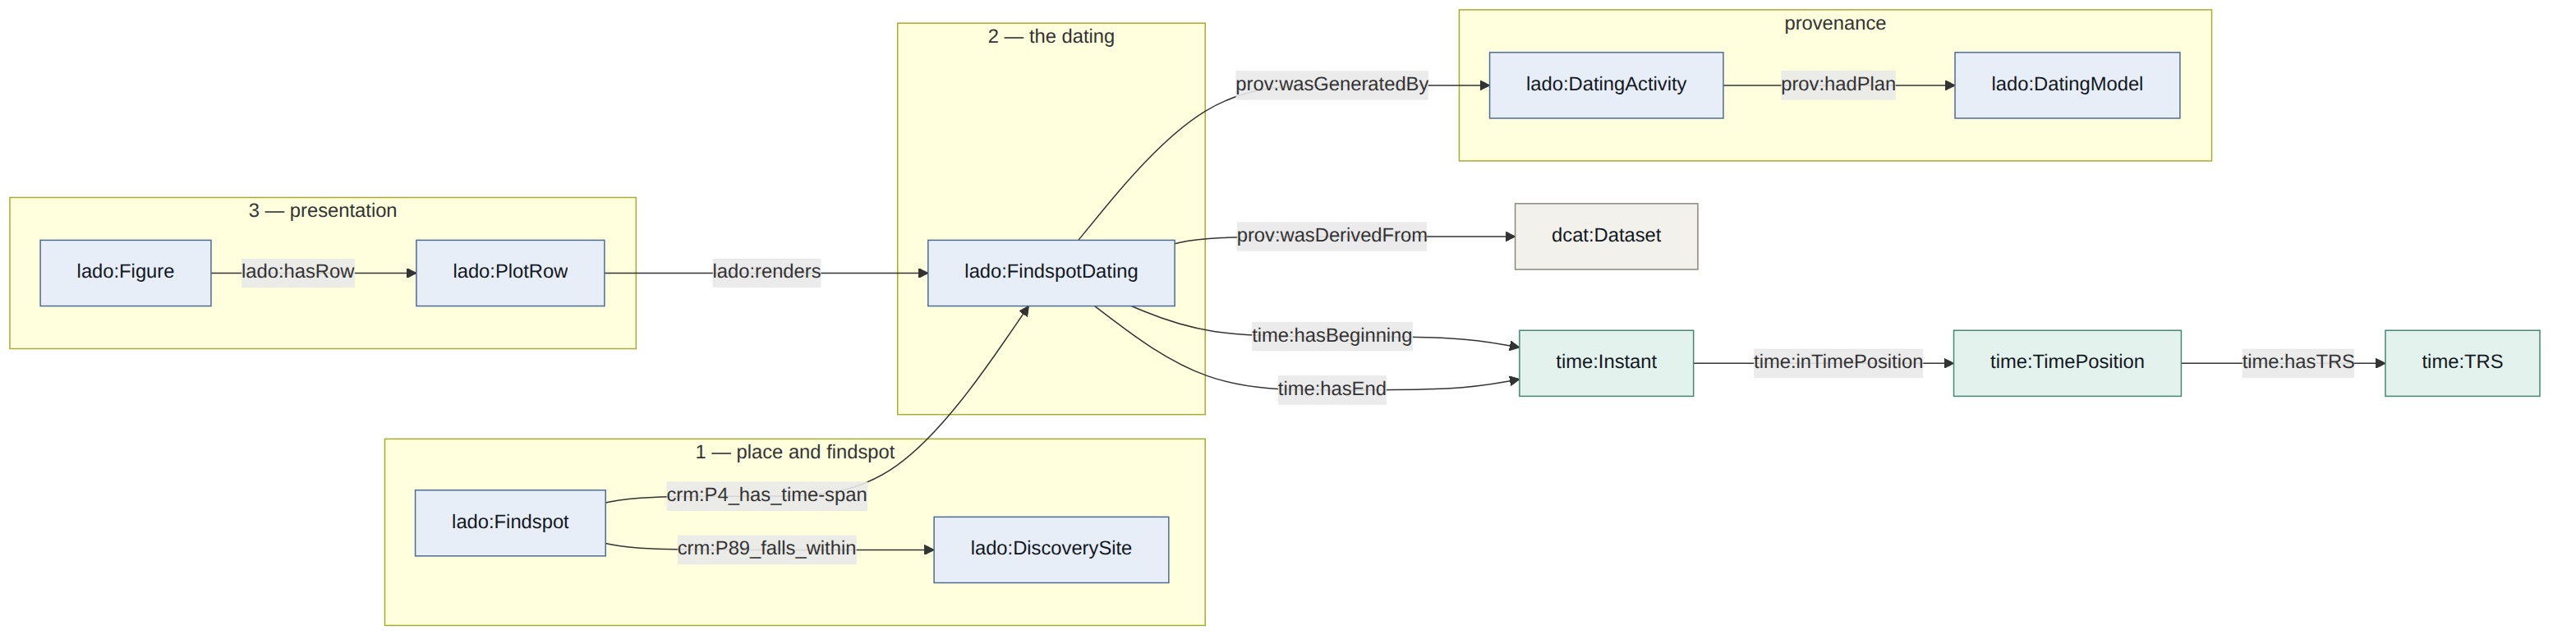





The export separates what is in the world, what we claim about it, and what the drawing does. The separation is not tidiness for its own sake: it determines what a SPARQL query picks up.
samian:loc_ds_<id>          already published, referenced only
samian:fs_<id>_<hash>       lado:Findspot, crm:P89_falls_within the site
The discovery site is not re-minted. the_id from the source
join is the dc:identifier of an already published node, and all 3,879 of
those identifiers match their URI suffix exactly, so the URI can be
constructed directly with no lookup table. This export adds an
rdfs:label and, where present, the ancient name and Pleiades identifier;
it does not re-type the node or restate what the published file already
says.
The findspot is new. It exists because a site may carry several findspots with different dates — Bregenz has four — and hanging four time-spans directly off one place would lose which is which.
samian:ts_<id>_<hash>       lado:FindspotDating
                            -> crm:E52_Time-Span, time:ProperInterval
Carries the interval boundaries as OWL-Time instants, and with them every
quantity needed to recompute the interval: sigma, k, the stamp count with
die attribution, the die count, the repetition, and both quality axes. The
identity width = 2·k·σ can be verified from the exported figures alone,
which is the point of exporting them.
samian:plotrow_<id>_<hash>  lado:PlotRow, lado:renders the dating
samian:fig_<name>           lado:Figure, constants of the drawing
The whiskers live here rather than on the time-span. The method documentation describes the edge dispersion as visual only — it measures the scatter of the interval edges, whereas the box is built from the scatter of the midpoints, so the whisker does not continue the box in any statistical sense. Attaching it to the dating would assert that it does.
The figure constants sit on a single node instead of being repeated on each of the rows, because they describe the drawing and not the findspots.
| Constant | Value | Meaning |
|---|---|---|
lado:padYears |
60 |
Years of empty space added at each end of the time axis. |
lado:extremeStubYears |
10 |
Length of the stub drawn at each extreme value. The full range line was replaced by these stubs in the web application, and both figures follow that decision. |
lado:rowHeight |
36 |
Height of one row, in pixels. |
lado:svgWidth |
1200 |
Width of the figure canvas, in pixels. |
lado:marginLeft |
400 |
Left margin, in pixels; it accommodates the site and findspot labels. |
lado:marginRight |
260 |
Right margin, in pixels. |
lado:marginTop |
40 |
Top margin, in pixels. |
lado:marginBottom |
120 |
Bottom margin, in pixels. |
lado:bandPadding |
0.4 |
Fraction of each row left empty between bars, following the d3.scaleBand convention. |
lado:colourRamp |
interpolateRdYlGn |
Name of the colour ramp mapping quality to colour, recorded so that a reader can reproduce the fill colours rather than eyeballing them. |
lado:rowOrder |
avg_datemin ASC |
The rule by which rows are sorted, allowing the order of the published figure to be reproduced from the graph alone. |
flowchart LR
    subgraph place["1 — place and findspot"]
        direction TB
        lado_DiscoverySite["lado:DiscoverySite"]
        lado_Findspot["lado:Findspot"]
    end
    subgraph dating["2 — the dating"]
        direction TB
        lado_FindspotDating["lado:FindspotDating"]
    end
    subgraph presentation["3 — presentation"]
        direction TB
        lado_Figure["lado:Figure"]
        lado_PlotRow["lado:PlotRow"]
    end
    subgraph provenance["provenance"]
        direction TB
        lado_DatingActivity["lado:DatingActivity"]
        lado_DatingModel["lado:DatingModel"]
    end
    dcat_Dataset["dcat:Dataset"]
    time_Instant["time:Instant"]
    time_TRS["time:TRS"]
    time_TimePosition["time:TimePosition"]
    lado_Findspot -->|crm:P89_falls_within| lado_DiscoverySite
    lado_Findspot -->|crm:P4_has_time-span| lado_FindspotDating
    lado_FindspotDating -->|time:hasBeginning| time_Instant
    lado_FindspotDating -->|time:hasEnd| time_Instant
    time_Instant -->|time:inTimePosition| time_TimePosition
    time_TimePosition -->|time:hasTRS| time_TRS
    lado_PlotRow -->|lado:renders| lado_FindspotDating
    lado_Figure -->|lado:hasRow| lado_PlotRow
    lado_FindspotDating -->|prov:wasGeneratedBy| lado_DatingActivity
    lado_DatingActivity -->|prov:hadPlan| lado_DatingModel
    lado_FindspotDating -->|prov:wasDerivedFrom| dcat_Dataset
    class lado_DatingActivity,lado_DatingModel,lado_DiscoverySite,lado_Figure,lado_Findspot,lado_FindspotDating,lado_PlotRow local
    class time_Instant,time_TRS,time_TimePosition time
    class dcat_Dataset ext

    classDef local fill:#e8eef7,stroke:#4a6b96,stroke-width:1px,color:#12181f
    classDef crm fill:#efe7f5,stroke:#7a5a96,stroke-width:1px,color:#12181f
    classDef time fill:#e3f2ec,stroke:#3f8a70,stroke-width:1px,color:#12181f
    classDef ext fill:#f3f1ec,stroke:#8a857a,stroke-width:1px,color:#12181f
    classDef io fill:#faf3e3,stroke:#a8872e,stroke-width:1px,color:#12181f
The class skeleton. Boxes outside the three groups belong to OWL-Time and PROV-O: they carry no layer of ours.
JPG · SVG · Mermaid source — generated, do not edit.
| SQL column | Subject | Predicate |
|---|---|---|
the_id |
samian:loc_ds_<id> |
(forms the URI) |
the_site |
samian:loc_ds_<id> |
rdfs:label |
the_findspot |
samian:fs_<id>_<hash> |
rdfs:label, skos:notation |
latinsitename |
samian:loc_ds_<id> |
lado:ancientName |
pleiades |
samian:loc_ds_<id> |
lado:pleiadesID |
long, lat |
samian:loc_ds_<id> |
geo:hasGeometry (optional) |
eff_start, eff_end |
samian:ts_<id>_<hash> |
time:hasBeginning / time:hasEnd |
count_stamps |
samian:ts_<id>_<hash> |
lado:nStamps |
n_stamps_die |
samian:ts_<id>_<hash> |
lado:nStampsWithDie |
n_dies |
samian:ts_<id>_<hash> |
lado:nDies |
die_repetition |
samian:ts_<id>_<hash> |
lado:dieRepetition |
q_repetition |
samian:ts_<id>_<hash> |
lado:qRepetition |
q_interval |
samian:ts_<id>_<hash> |
lado:qInterval |
q_start, q_end |
samian:ts_<id>_<hash> |
lado:qStart / lado:qEnd |
sigma_eff |
samian:ts_<id>_<hash> |
lado:sigmaYears |
k_eff |
samian:ts_<id>_<hash> |
lado:kFactor |
k_no_dierecord |
samian:ts_<id>_<hash> |
lado:kNoDieRecord |
midpoint_year |
samian:ts_<id>_<hash> |
lado:midpointYear |
avg_datemin, avg_datemax |
samian:ts_<id>_<hash> |
lado:avgDatemin / lado:avgDatemax |
min_datemin, max_datemin |
samian:ts_<id>_<hash> |
lado:minDatemin / lado:maxDatemin |
min_datemax, max_datemax |
samian:ts_<id>_<hash> |
lado:minDatemax / lado:maxDatemax |
avg_interval |
samian:ts_<id>_<hash> |
lado:intervalLabel |
unc_start_years |
samian:plotrow_<id>_<hash> |
lado:uncStartYears |
unc_end_years |
samian:plotrow_<id>_<hash> |
lado:uncEndYears |
unc_interval_years |
samian:plotrow_<id>_<hash> |
lado:uncIntervalYears |
p_k_min, p_k_max, p_tau, p_w |
samian:DatingModel_v1 |
lado:kMin / kMax / tau / volumeWeight |
flowchart LR
    PL["samian:loc_ds_1003978<br/><i>Amiens</i><br/>lado:DiscoverySite"]
    FS["samian:fs_1003978_969c47<br/><i>Sq. Bocquet pit 1973</i><br/>lado:Findspot"]
    TS["samian:ts_1003978_969c47<br/>lado:FindspotDating<br/>sigma 12.2 · k 0.5011 · q 0.50"]
    BG["samian:ts_1003978_969c47_begin<br/>time:Instant"]
    PO["samian:ts_1003978_969c47_begin_pos<br/>time:TimePosition<br/>numericPosition -15.0"]
    RW["samian:plotrow_1003978_969c47<br/>lado:PlotRow<br/>uncStartYears 7"]

    FS -->|crm:P89_falls_within| PL
    FS -->|crm:P4_has_time-span| TS
    TS -->|time:hasBeginning| BG
    BG -->|time:inTimePosition| PO
    RW -->|lado:renders| TS

    class PL,FS,TS,RW local
    class BG,PO time

    classDef local fill:#e8eef7,stroke:#4a6b96,stroke-width:1px,color:#12181f
    classDef crm fill:#efe7f5,stroke:#7a5a96,stroke-width:1px,color:#12181f
    classDef time fill:#e3f2ec,stroke:#3f8a70,stroke-width:1px,color:#12181f
    classDef ext fill:#f3f1ec,stroke:#8a857a,stroke-width:1px,color:#12181f
    classDef io fill:#faf3e3,stroke:#a8872e,stroke-width:1px,color:#12181f
One real findspot, read from the generated graph. Change the model and this picture changes with it.
JPG · SVG · Mermaid source — generated, do not edit.
flowchart TB
    TS["lado:FindspotDating<br/>crm:E52_Time-Span · time:ProperInterval"]
    I["time:Instant<br/>lado:DatingInstant"]
    P["time:TimePosition<br/>lado:DatingTimePosition"]
    TRS["samian:trs_ips_year<br/>time:TRS · lado:YearScale"]
    NUM["time:numericPosition<br/><b>-15.0</b><br/><i>signed number line,<br/>never shifted</i>"]
    CAL["time:inXSDgYear<br/><b>-0014</b><br/><i>calendar label,<br/>shifted by +1 for BC</i>"]
    GREG["ISO-8601 Gregorian"]

    TS -->|time:hasBeginning| I
    I -->|time:inTimePosition| P
    P -->|time:hasTRS| TRS
    P --> NUM
    I --> CAL
    TRS -.->|skos:closeMatch| GREG

    class TS,TRS local
    class I,P time
    class NUM,CAL io
    class GREG ext

    classDef local fill:#e8eef7,stroke:#4a6b96,stroke-width:1px,color:#12181f
    classDef crm fill:#efe7f5,stroke:#7a5a96,stroke-width:1px,color:#12181f
    classDef time fill:#e3f2ec,stroke:#3f8a70,stroke-width:1px,color:#12181f
    classDef ext fill:#f3f1ec,stroke:#8a857a,stroke-width:1px,color:#12181f
    classDef io fill:#faf3e3,stroke:#a8872e,stroke-width:1px,color:#12181f
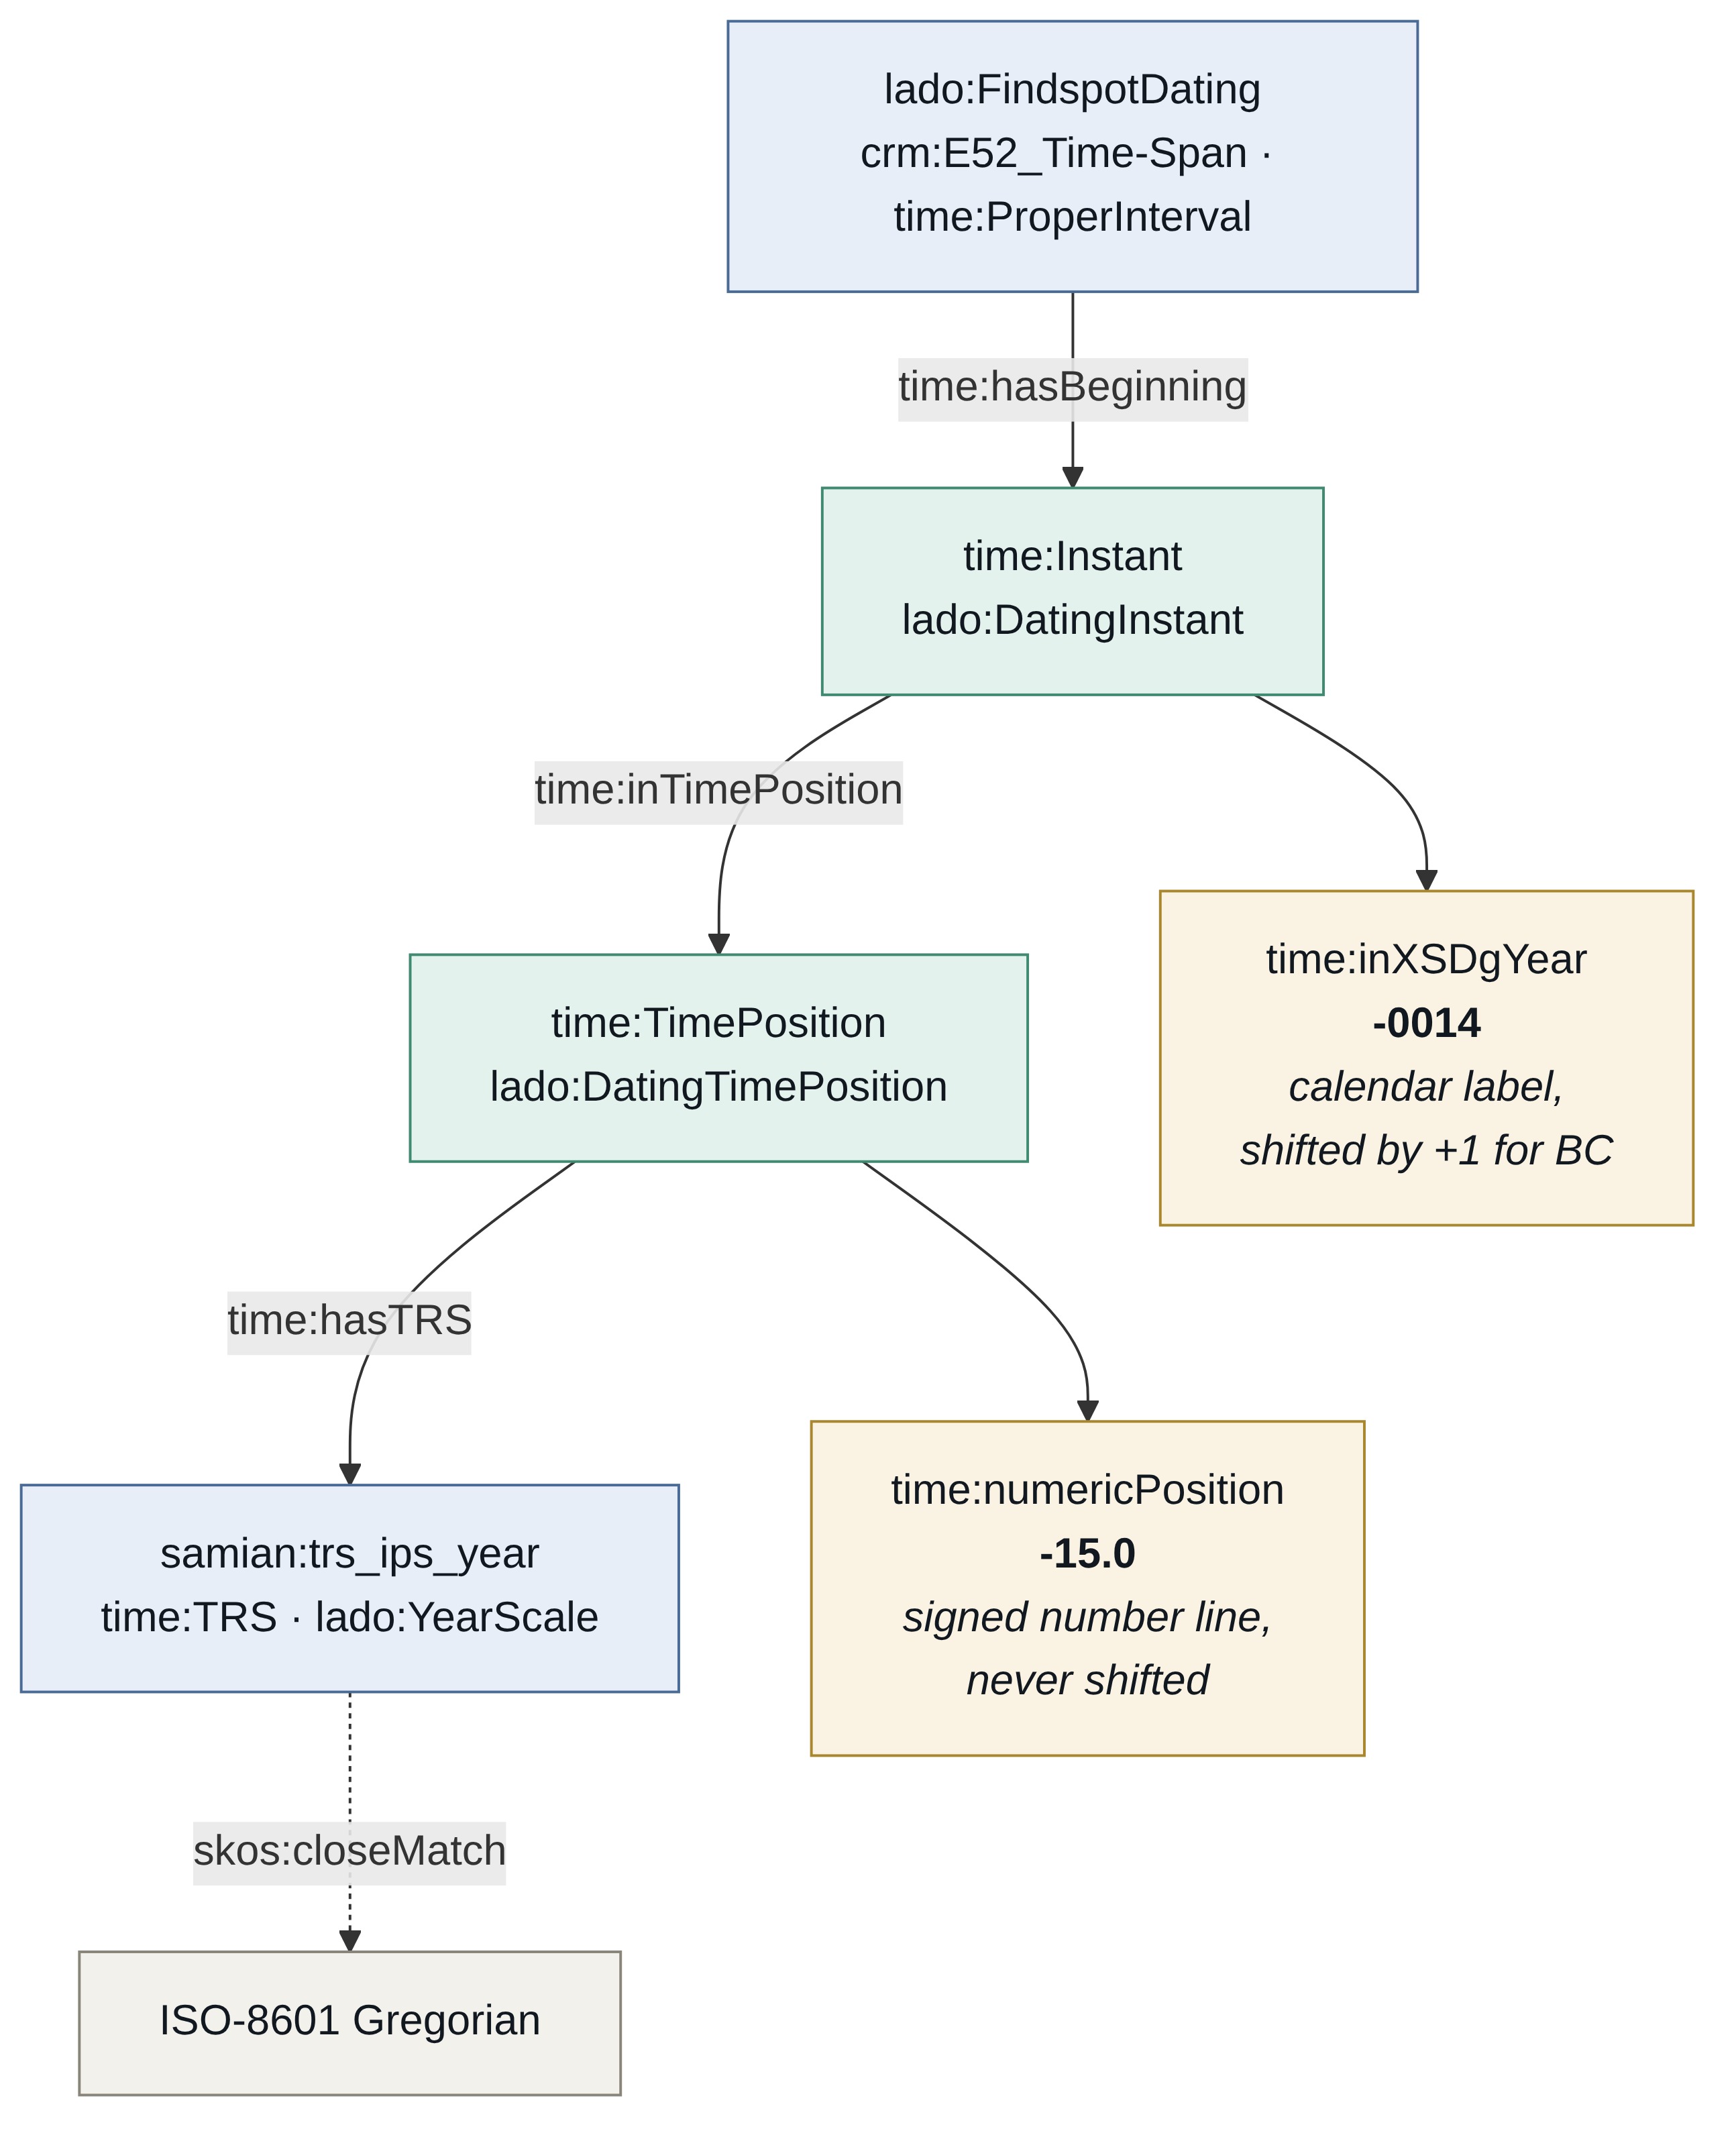
One boundary, all the way down. The fork at the bottom is the point: the calendar label and the arithmetic position disagree about negative years on purpose.
JPG · SVG · Mermaid source — generated, do not edit.
The same thing again, but drawn from the triples themselves rather than
from the model — cut out of the published graph with a CONSTRUCT and laid
out by GraphViz, so it can only show what is really there:
SVG · GraphViz source — cut from the graph by CONSTRUCT, generated, do not edit.
And the findspot in full:

SVG · GraphViz source — cut from the graph by CONSTRUCT, generated, do not edit.
flowchart LR
    TS["lado:FindspotDating<br/><i>the dating</i>"]
    ACT["lado:DatingActivity<br/>prov:Activity · crmdig:D10_Software_Execution"]
    MOD["lado:DatingModel<br/>prov:Plan · crm:E29_Design_or_Procedure<br/><i>kMin kMax tau referenceLength<br/>volumeWeight eraConvention<br/>excludedDatemax</i>"]
    AG["samian:IPSDatedSitesExporter<br/>prov:SoftwareAgent · crmdig:D14_Software"]
    DS["dcat:Dataset<br/><i>dated snapshot</i>"]

    TS -->|prov:wasGeneratedBy| ACT
    TS -->|prov:wasDerivedFrom| DS
    ACT -->|prov:used| MOD
    ACT -.->|crm:P33_used_specific_technique| MOD
    ACT -->|prov:wasAssociatedWith| AG
    ACT -.->|crm:P14_carried_out_by| AG
    ACT -->|prov:used| DS

    class TS,ACT,MOD,AG local
    class DS ext

    classDef local fill:#e8eef7,stroke:#4a6b96,stroke-width:1px,color:#12181f
    classDef crm fill:#efe7f5,stroke:#7a5a96,stroke-width:1px,color:#12181f
    classDef time fill:#e3f2ec,stroke:#3f8a70,stroke-width:1px,color:#12181f
    classDef ext fill:#f3f1ec,stroke:#8a857a,stroke-width:1px,color:#12181f
    classDef io fill:#faf3e3,stroke:#a8872e,stroke-width:1px,color:#12181f
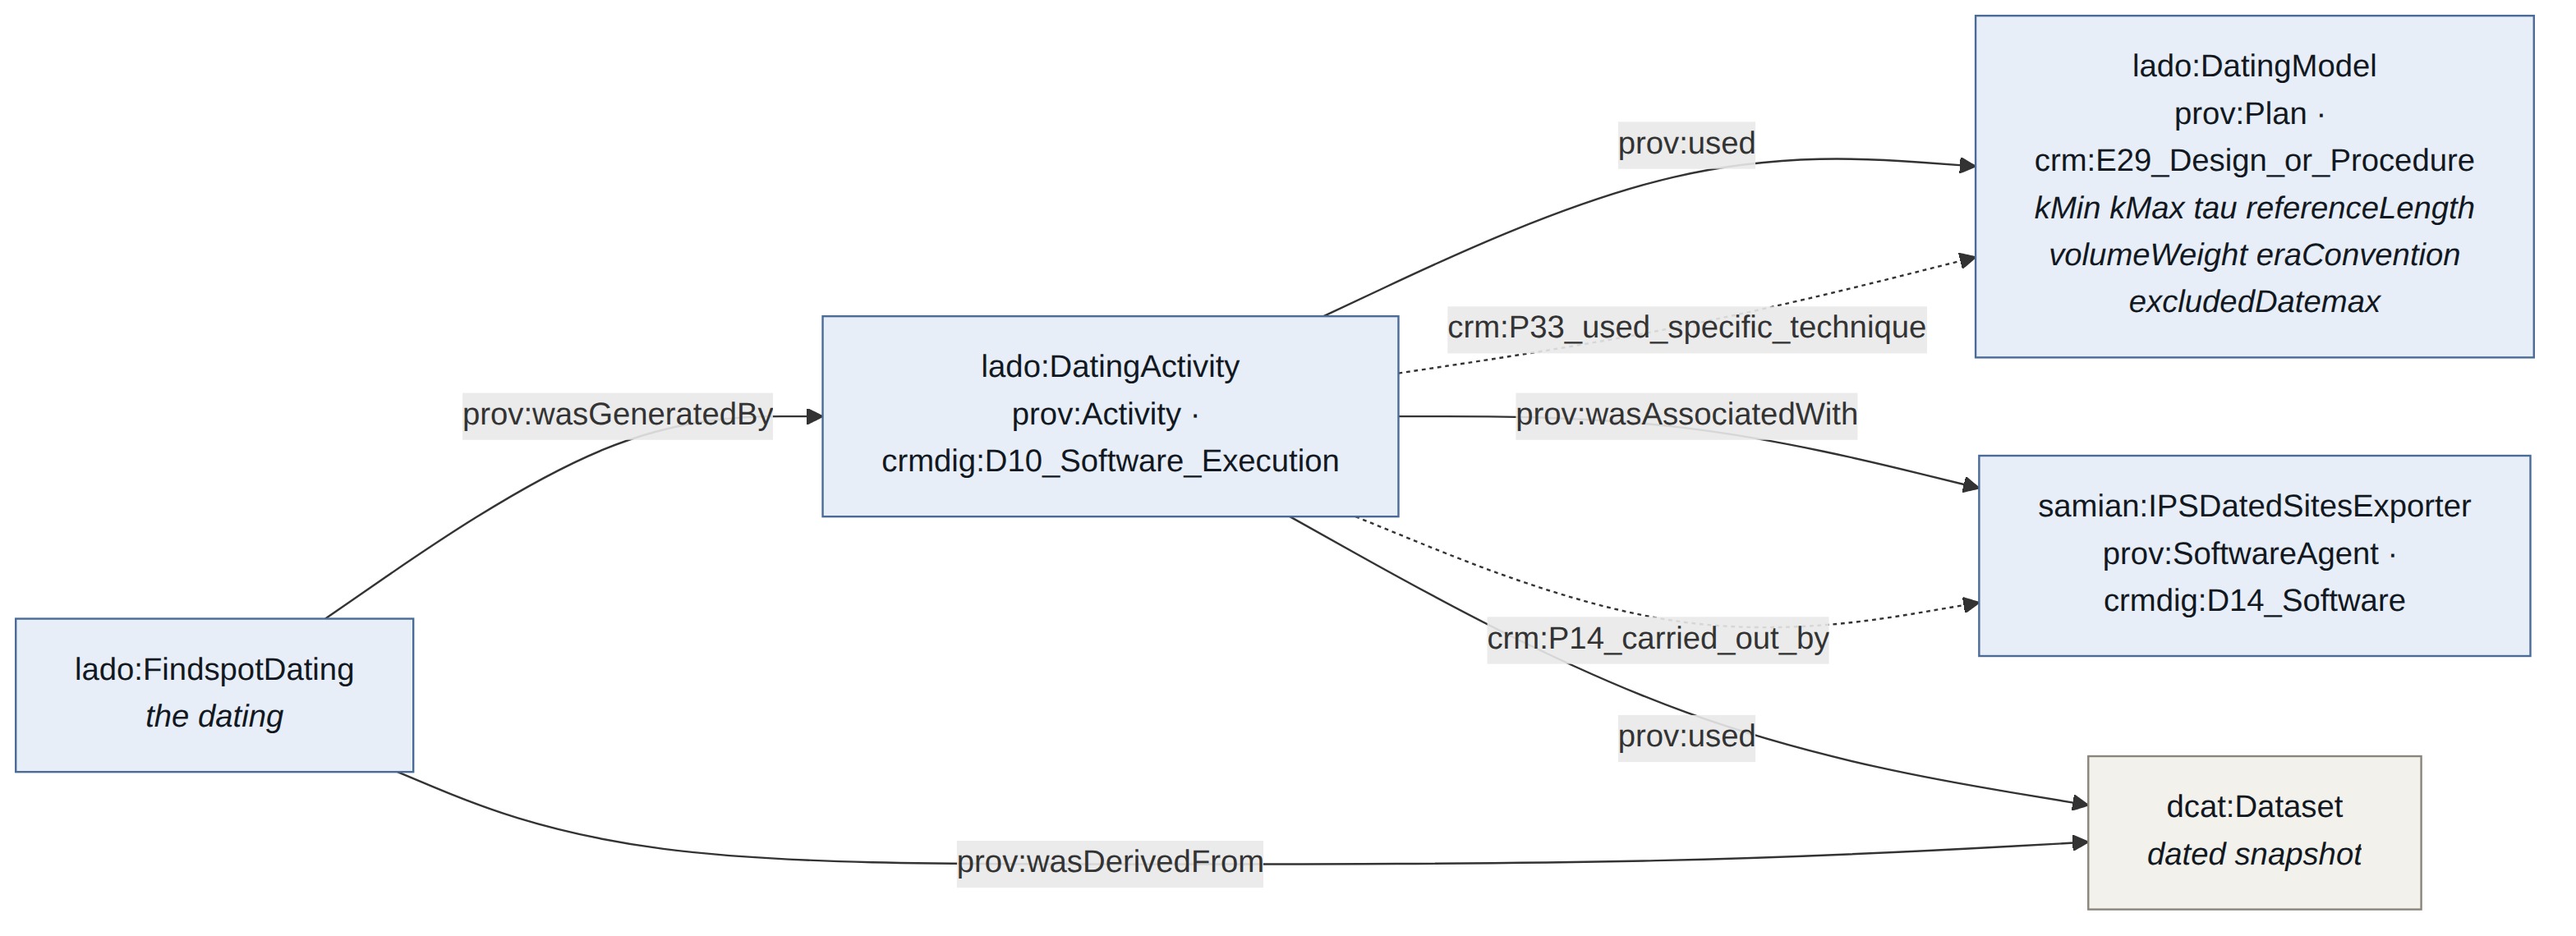
Two vocabularies say the same thing on purpose: PROV for the provenance world, CIDOC CRM so that a CRM-only consumer sees the method too.
JPG · SVG · Mermaid source — generated, do not edit.

SVG · GraphViz source — cut from the graph by CONSTRUCT, generated, do not edit.
Note in the drawn version that lado:tau and lado:referenceLength end at
the same literal. They both read 20, and identical literals are the same
term in RDF, so the two arrows genuinely land on one node. The shared value
is a coincidence: tau governs how fast the interval tightens as stamps
accumulate, referenceLength is the fixed scale against which qStart and
qEnd are read.
Findspot fragments are built as sha256(NFC(trim(findspot)))[0:6], per discovery-site id. The recipe is
recorded in the graph as lado:identifierScheme, because any further
implementation — the planned JavaScript port in particular — must
reproduce it character for character. The Unicode normalisation step is
not cosmetic: if the source yields ö once as U+00F6 and once as
o+U+0308, the two forms hash differently and one findspot becomes two.
The export checks for collisions and stops rather than silently merging
two findspots that hash alike.
A hash does not make the URI stable. If someone corrects a findspot name,
the hash changes exactly as a readable slug would; it simply changes
invisibly. The readable slug is therefore retained as skos:notation so
that a broken link remains diagnosable. There is a live example in the
data: one findspot is recorded as Böckleareal (descruction layer period
II), a typo for destruction, sitting in a field from which URIs are
minted.
Time-span URIs are deliberately not versioned. They denote the current
dating of a findspot, so their values change when the source data change.
What is citable is the dated dataset node, which carries dcterms:issued
and owl:versionInfo; every dating points at it with
prov:wasDerivedFrom.
Where a value cannot be computed, the triple is omitted — never replaced
by zero or by 0.5. A fallback of 0.5 would be indistinguishable from a
measured 0.5, which is reachable, and the source query’s COALESCE
wrappers were removed for that reason.
Omission alone is ambiguous, because under the open-world assumption a missing triple only means unknown. The export therefore states the absence explicitly:
samian:ts_1000080_a1b2c3 lado:undefinedMeasure lado:qInterval .
The figure reads this as its third state: a grey box rather than a coloured one. If 0.5 were exported instead, anyone reconstructing the figure from the graph would draw a yellow-green box where the original draws grey — the fallback would make the figure irreproducible.
In the current data no measure is undefined; all 26 mapped columns are populated across every row.